
Open Analytics in your Shopify admin and your Shopify conversion rate sits there as one number. Take a hypothetical store where it reads 0.8%. Search for a benchmark and you’ll find three different numbers, none saying what to change.
In that store, the 0.8% of sessions that bought made it through every step to payment. The other 99.2% left somewhere along the way, and the single number can’t say where. Shopify’s funnel report shows every step, but the division that finds the leak is yours to do.
Why benchmarks won’t settle it
The figures disagree because they measure different things. Littledata puts the median Shopify store at 1.4%: sessions with a purchase over all sessions, across 426 stores from 6 July to 3 October 2026. Statista gives 1.3% worldwide for the second quarter of 2026, with no method on the page. Dynamic Yield’s 2.68% comes with no date range or sample size.
Even Shopify’s benchmarks post uses two definitions, one of which also counts newsletter signups and add to carts. Shopify Analytics counts only completed checkouts.
To find where shoppers leave, compare your store with itself.
Only compare data from after 23 September
Shopify changed how it counts sessions from 21 September 2026 (changelog), with the rollout finishing on 23 September (help page on the change). Sessions now end after 30 minutes of inactivity, not at midnight UTC. Some visits with no pageview now count, and identified bots are filtered out by default.
Your conversion rate can move with no change in orders. The help page says to treat this as a new baseline and check orders and sales, which the change didn’t touch.
Count whole weeks from Thursday 24 September 2026. Until you have four, judge steps only against the Littledata lines in step 6 below. On a few hundred sessions a week, wait until you can compare four weeks against four.
Read the four steps in Conversion rate breakdown
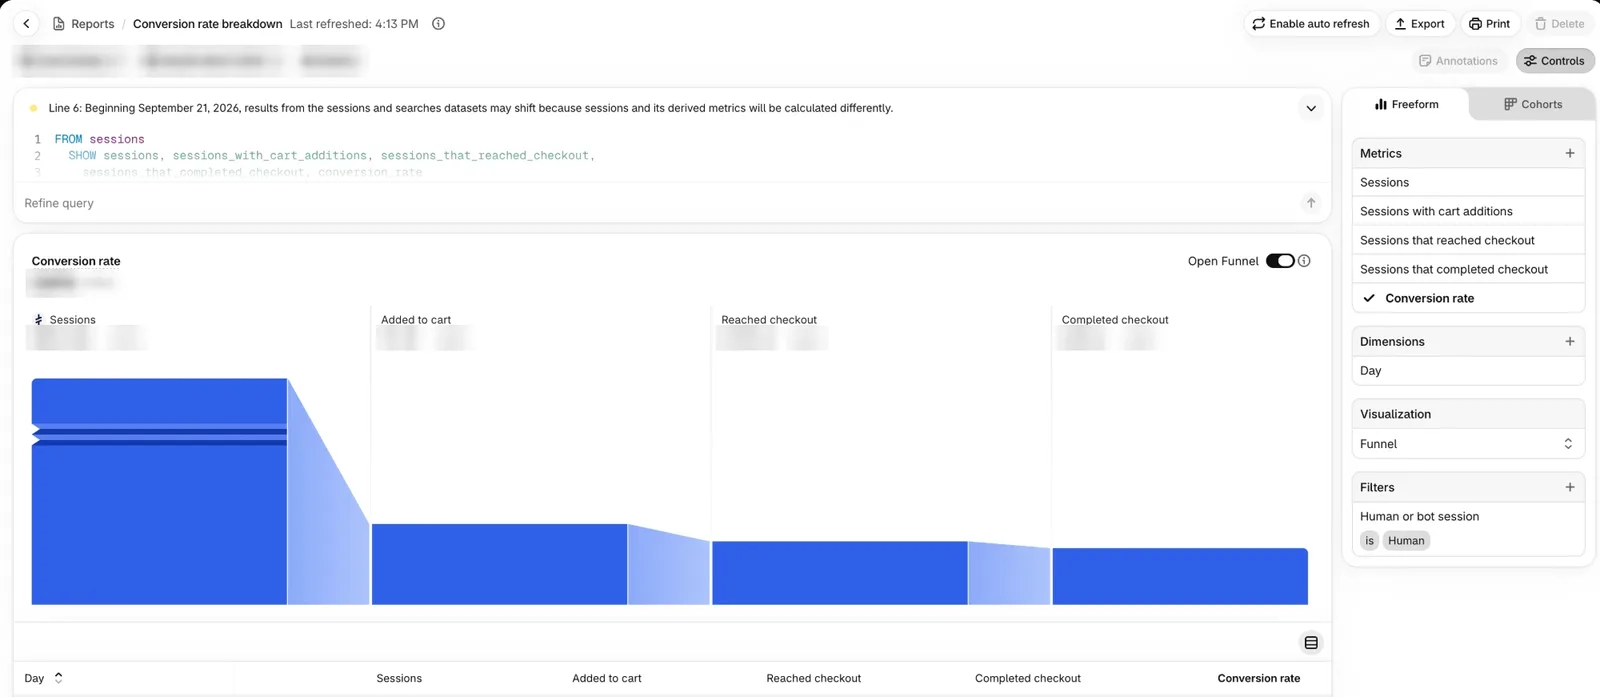
The report is Conversion rate breakdown (behaviour reports page). Its four steps, as Shopify’s analytics field reference defines them:
- Sessions: visits to your online store
- Sessions with cart additions: visits in which a shopper added an item to the cart
- Sessions that reached checkout: visits in which the checkout page was reached
- Sessions that completed checkout: visits in which a purchase was completed
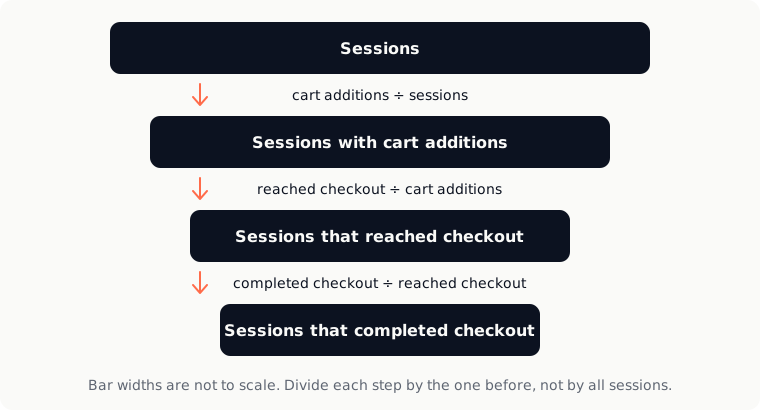
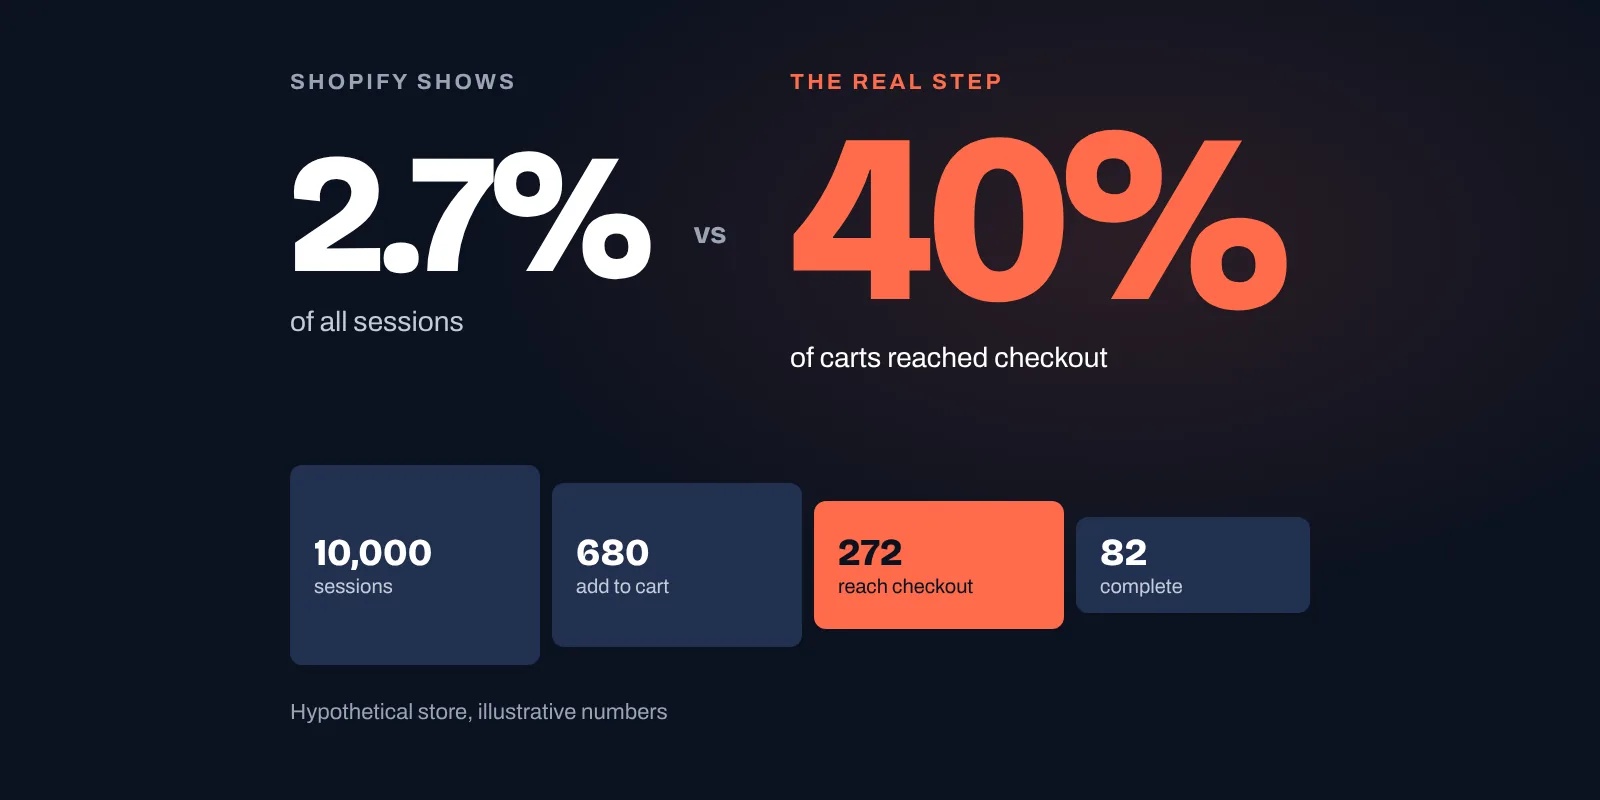
Shopify’s behaviour reports page says each step’s rate is “the number of sessions for a step divided by the number of total sessions”. Not by the step before. In the hypothetical store below, the checkout step shows 2.7%, which looks like a disaster, yet 40% of the shoppers who added to cart got there.
Shopify divides every step by all sessions, so a healthy checkout step can look broken.
- In your admin, go to Analytics > Reports, filter Category by Behavior and open Conversion rate breakdown.
- Set the date range to whole weeks starting on or after 24 September 2026.
- Check the Open Funnel toggle. On, it includes sessions that skipped steps or took them out of order; off, only sessions that took every step in order. Keep it, and the Human or bot session filter under Controls, the same throughout.
- Note the session count at each step, not the percentages.
- Divide each step by the one before: cart additions by sessions, reached checkout by cart additions, completed checkout by reached checkout.
- Call a step the leak if it’s below the bottom-20% line in Littledata’s benchmarks (3.4% for add to cart, 30% for checkout completion). They’re Google Analytics 4 figures, so treat them as a rough line. Once you can compare two post-change weeks against two, a step 40% or more below your own previous weeks counts too (our rule of thumb, not a benchmark). Cart to checkout has no published line, so it needs your own weeks.
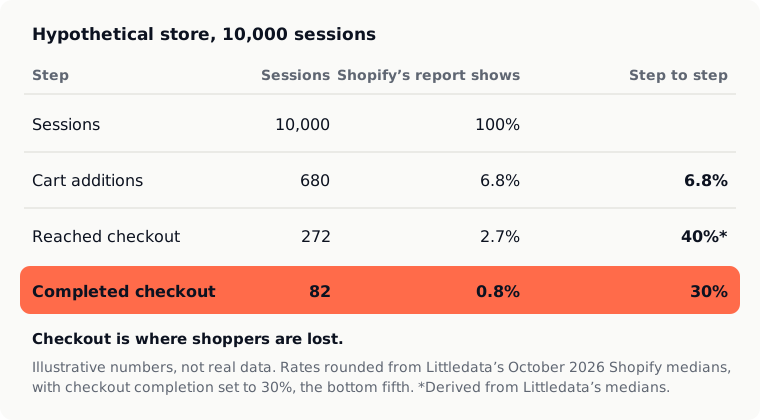
Same store, two readings of one funnel
Take a hypothetical store with 10,000 sessions. No source measures cart to checkout, so its 40% is derived from Littledata’s cart abandonment and checkout completion medians.
| Step | Sessions | Shopify’s report shows | Step to step |
|---|---|---|---|
| Sessions | 10,000 | 100% | |
| Cart additions | 680 | 6.8% | 6.8% |
| Reached checkout | 272 | 2.7% | 40% (derived) |
| Completed checkout | 141 | 1.4% | 52% |
The rest is arithmetic on Littledata’s add-to-cart and checkout completion medians.
That’s a median store. Change one thing: checkout completion falls to 30%, the bottom-fifth line on Littledata’s checkout completion benchmark. The same 272 checkouts produce 82 purchasing sessions, and the conversion rate drops to 0.8%.
Shopify’s report would show 6.8%, 2.7% and 0.8%, and nothing tells you whether that last drop is normal. Divided step by step, it’s 6.8%, 40% and 30%. Checkout is where shoppers are lost, and where the week should go.
Split the leaking step by device and landing page
Conversion rate breakdown runs on a ShopifyQL query, shown above its chart. The version below adds device type and a start date. Go to Analytics > Reports, click New exploration, open the ShopifyQL editor, paste the query below and click Run. Shopify says creating a data exploration is available on all plans.
FROM sessions
  SHOW session_device_type, sessions, sessions_with_cart_additions,
    sessions_that_reached_checkout, sessions_that_completed_checkout
  GROUP BY session_device_type
  SINCE 2026-09-24
SINCE 2026-09-24 limits the results to sessions after the change (ShopifyQL date syntax). Swap session_device_type for landing_page_path in both lines to see the same funnel by landing page (ShopifyQL sessions schema).
Sidekick, Shopify’s assistant, can also generate the ShopifyQL from a plain-language request in New exploration. Shopify doesn’t say it divides each step by the one before, so check its figures against the four session counts.
Work out the leaking step’s rate for each device. If one is well below the other over the same weeks, say a third lower, start your checks there.
There’s no per-product funnel: the sessions schema has no product dimension.
What each weak step points to
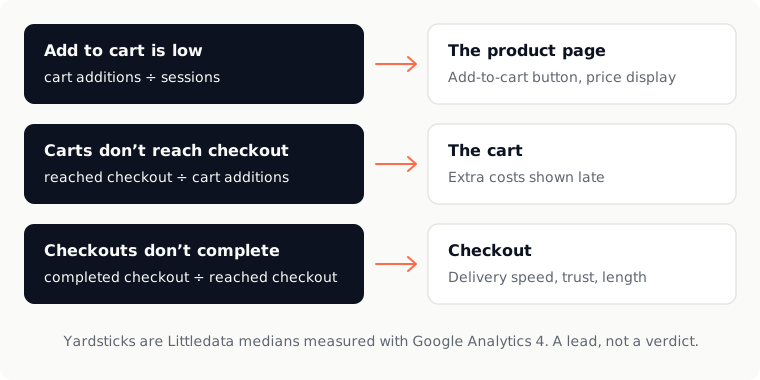
Add-to-cart rate is low: the product page
Find the product pages dragging the rate first:
- Run the query above with
landing_page_pathin place ofsession_device_type. - Sort by sessions and take the top 10 product pages.
- Divide each page’s cart additions by its sessions.
- Start with any page under half your store-wide add-to-cart rate.
Carts don’t reach checkout: the cart
Add an item on your phone and note the first screen that shows the delivery cost. If it’s the cart or later, test moving it earlier. Extra costs top Baymard’s cart abandonment list (last updated 22 September 2025): 40% of US online shoppers who abandoned, leaving out those just browsing, said extra costs were too high.
Checkouts don’t complete: checkout
Run a test checkout on your phone and count the fields and screens before payment. On the same Baymard list, 17% of US online shoppers who abandoned blamed a checkout that was too long or complicated. Some of that is yours to set, in Settings > Checkout (Shopify’s checkout form options):
- Customer contact method: check whether Require customers to sign in to their account before checkout is on. It makes every buyer sign in first and hides accelerated buttons such as Apple Pay in the cart (sign-in setting).
- Customer information: set Company name to Don’t include unless you sell to businesses, and Shipping address phone number to Optional unless your carrier or payment provider needs one. Leave Address line 2 on Optional: Shopify warns that the other choices can stop some shoppers finishing. Full name can drop to Only require last name.
The customer information settings don’t apply to B2B checkouts. Run the test checkout again: the field count should drop. Some loss is normal: 42% of US online shoppers on Baymard’s list abandoned because they were “just browsing”.
Reached checkout is higher than cart additions
Shopify’s field reference explains it: checkouts can exceed add-to-cart counts when customers buy through channels such as Instagram Shopping or Facebook Shops without visiting your cart page. Accelerated checkout buttons, which skip the cart, may add to the gap; Shopify doesn’t say how they’re counted. Cart links that go straight to checkout may too, since they count as sessions from September 2026.
A CRO audit checks every page between the ad and the order confirmation, and ranks the fixes.
How to know a fix worked
After you change the leaking step, watch that one step-to-step rate, on the device where it broke, across matching whole weeks. Count the fix as working once the step is back above the line from step 6, or back in line with your weeks before the drop.
Check orders too. The report’s completed-checkout sessions won’t always match your order count, because one session can include several purchases and Shopify counts it once.
To put a figure on the change, the conversion rate calculator shows what each extra 0.1 points is worth in orders and revenue.
Checklist
- Whole-week date ranges from 24 September 2026 onwards
- The same Open Funnel setting and Human or bot filter in every period
- Each step’s session count divided by the step before
- The out-of-line step split by device, then by landing page
- One change, then the same rate over matching weeks
- Orders checked alongside sessions
A practical plan for your store, ads and email, and a partner who keeps meeting with you as the numbers move.

A collective of ecommerce veterans with 15+ years across marketing, development and UX. We audit stores, coach teams and build tools for Shopify merchants.