
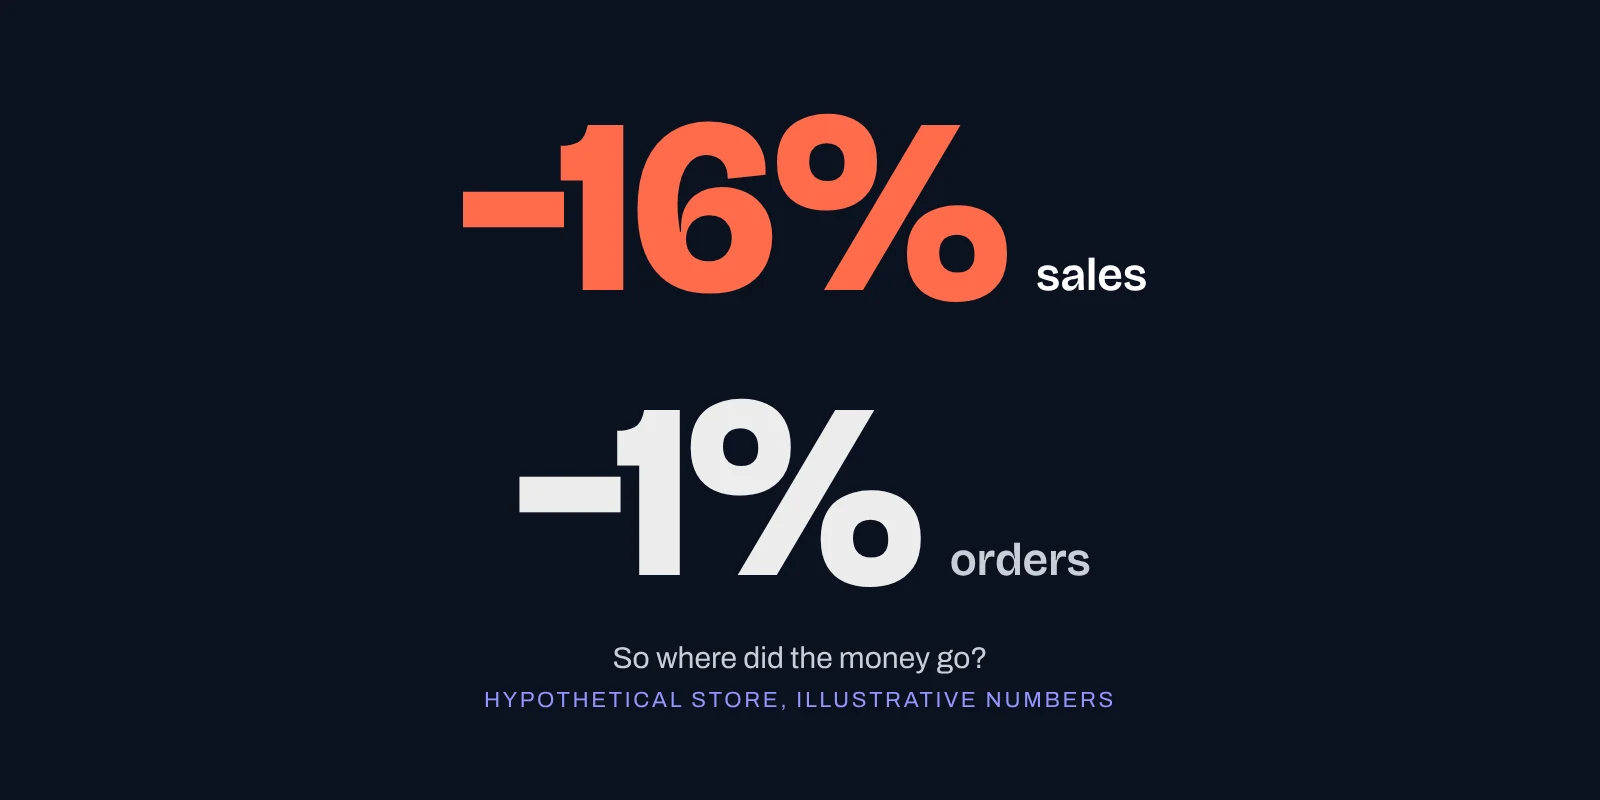
Say your store took $26,900 over the last four weeks, against $32,000 over the same four weeks of 2025. That’s 16% gone, and you probably have a suspect already: the ads, or the new theme.
Your Shopify sales dropped because one of four numbers moved: orders, order value, sessions or conversion rate. Put simply, fewer people came, fewer of them bought, or each order was worth less. Each has a different fix, so find out which before you change anything.
Four numbers make your sales
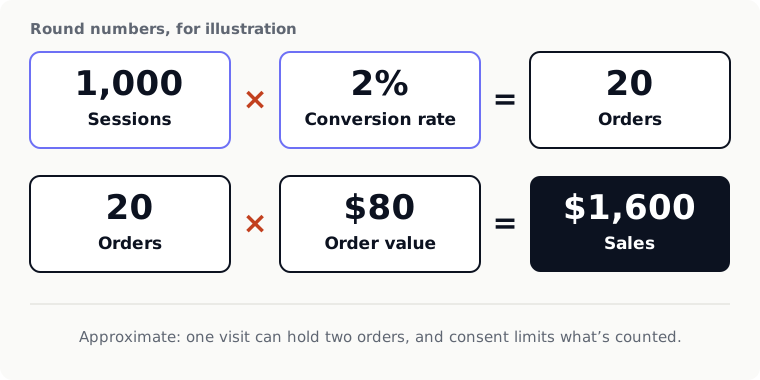
Your sales come from a chain. With round numbers:
- Sessions: 1,000 visits to your online store.
- Conversion rate: 2 in every 100 of those visits end in a completed checkout (how Shopify counts it).
- Orders: that makes 20 orders.
- Average order value (AOV): each order is worth $80.
- Sales: 20 orders at $80 is $1,600.
When sales fall, one link in the chain got smaller. Halve the conversion rate and you get 10 orders and $800 in sales, from exactly the same visitors.
Two caveats:
- Sessions only count your online store (acquisition reports). Compare them with online sales only.
- The chain is close, not exact. A shopper who buys twice in one visit counts as one conversion. Where cookie consent is required, Shopify only collects data after the shopper accepts (why orders and sessions differ).
Compare with the same weeks last year
Last month is the wrong yardstick for most stores, because online spending has seasons. US ecommerce rose 9.4% from the first quarter of 2026 to the second before seasonal adjustment, and 3.8% after it (Census Q2 2026 first estimate, 18 August 2026; revised estimates due 19 November 2026). The gap between those two figures is the season. Your weeks carry the same kind of swing, so compare with the same weeks last year.
Line up the weekdays too. The same dates a year apart fall on different days of the week. Use whole weeks, Monday to Sunday, and start last year’s range 52 weeks earlier so it begins on the same weekday. In a report, click Compare to in the upper-left corner, choose Comparison to past, then set a Custom range with its start and end dates and click Apply (time ranges). These steps are for a report in Analytics > Reports.
Shopify sessions dropped? Check the September 2026 counting change first
Shopify changed how it counts sessions between 21 and 23 September 2026 (help page on the change). Sessions now end after 30 minutes of inactivity. Some visits with no pageview now count, and identified bots are filtered out by default. Sessions can rise or fall as a result, and conversion rate can move either way with no change in who’s shopping. Orders, sales and customer counts aren’t affected, Shopify says, though metrics that attribute orders or customers to sessions can still shift.
The history wasn’t reworked: Shopify says your historical data “isn’t deleted or reprocessed”. Orders, sales and AOV can cross the change safely. Sessions and conversion rate can only be compared between periods counted the same way, which depends on when your drop started:
- Before 21 September 2026: compare with the same weeks of 2025, both counted the old way. Shopify’s bot classification only goes back to 7 October 2025, so set the Human or bot session filter to include bot sessions in both periods.
- After 23 September 2026: compare post-change weeks with the post-change weeks just before them. The first whole post-change week starts on Monday 28 September 2026. That comparison carries a seasonal swing, so weigh it against what orders did over the same weeks last year.
A year-on-year session comparison is like for like only once both years fall after the change: for weeks starting on or after Monday 27 September 2027.
Split the drop
- Go to Analytics > Reports and open Total sales over time. It shows orders and total sales.
- Add the filter Sales channel is Online Store (filtering reports).
- Pick your last four whole weeks, Monday to Sunday. Compare them with a custom range: the same four weeks, 52 weeks earlier.
- Write down the orders for both periods.
- Open Average order value over time with the same dates, and add the same filter if the report offers it. Write down the AOV for both periods.
- See which changed more, orders or AOV. That’s the number that moved.
- If orders fell, open Sessions over time and Conversion rate over time. Compare only periods Shopify counted the same way, using the dates in the section above.
Take AOV from its own report rather than dividing total sales by orders yourself. Shopify works AOV out as gross sales minus discounts, divided by orders, “excluding post-order adjustments” (sales reports). Total sales also includes shipping, taxes, duties and fees (ShopifyQL sales reference), so your own division won’t match the report.
One store, worked through
Back to the store at the top, down 16% on the same four weeks of 2025. Say it sells only online, and its owner’s first suspect is the ads. Here are its four weeks (hypothetical):
| Online Store, four weeks | 2025 | 2026 | Change |
|---|---|---|---|
| Orders × AOV (shipping and tax ignored) | $32,000 | $26,900 | −16% |
| Orders | 400 | 396 | −1% |
| Average order value | $80.00 | $67.93 | −15% |
| Discounts | $2,000 | $6,700 | +235% |
| Discount per order | $5.00 | $16.92 | +238% |
Orders barely moved. As a rough rule of thumb from the arithmetic, not a Shopify figure, an order count wobbles by about its square root from one period to the next, so on 400 orders over four weeks, about 20 either way is ordinary. A fall to 396 is well inside that, so traffic and conversion didn’t cause this drop. AOV fell 15%, and that accounts for almost all of the drop.
Orders and AOV come from the steps above, and discounts from Sales by discount codes. The store sells only online, so every figure is Online Store. Add the discount per order back onto AOV and you get what shoppers spent before discounts: $85.00 an order in 2025, $84.85 in 2026. The baskets held; the discount moved. In the hypothetical store, Sales by discount codes shows SUMMER20, 20% off, on 276 of the 396 orders: about $4,700 of the $6,700. The code from a summer sale was never switched off.
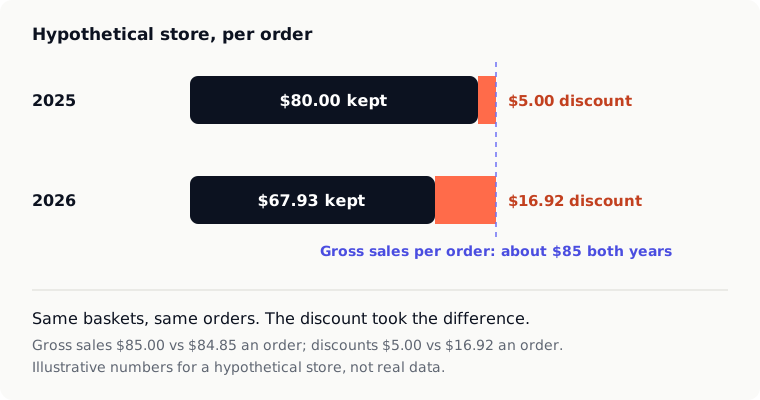
In the hypothetical store, sales fell 16% while orders fell 1%, so the shoppers still came and the discount took the difference.
What each result points to
Find your result, then read its section.
| What you see | Where to look first |
|---|---|
| Orders held, order value fell | Sales by discount codes |
| Orders and sessions fell, conversion rate held | Sessions by referrer |
| Orders and conversion rate fell, sessions held | Your funnel, step by step |
| Sessions and conversion rate moved opposite ways across 21–23 September 2026, orders flat | Orders, against last year |
Orders held, order value fell
- What it means: shoppers still buy, but each order is worth less. Look at discounts first, then at which products sold.
- Where to look: open Sales by discount codes in Analytics > Reports for both periods. It shows each discount’s amount, orders and total sales (sales reports). Its sales figure counts only the line items each discount touched. Shopify doesn’t say whether this report can be filtered by Sales channel, so check its Filters menu. If you also sell in person and there’s no such filter, use an order export, or a ShopifyQL query in a new exploration grouped by the
sales_channeldimension in Shopify’s sales schema. - To include POS discounts: open Discounts by order. Shopify says it covers discount codes used at online checkout and discounts applied in POS, so automatic online discounts may not appear in it (finance reports). Like Shopify’s other default finance reports, it can’t be filtered.
- If discounts didn’t change: open Total sales by product for both periods (sales reports). A shift towards cheaper products lowers order value without costing a single order.
- If you stack discounts: Shopify announced in July 2026 that several product discounts can apply to the same item (Shopify changelog: multiple product discounts on the same item). Compare the discount per order in Sales by discount codes before and after the drop. With combinable discounts, the same order can appear there more than once.
Orders and sessions fell, conversion rate held
- What it means: fewer people visited. Those who came bought as often as before, so the store isn’t the problem.
- Where to look: open Sessions by referrer in Analytics > Reports. It shows whether the lost visits came directly, from search or by referral (acquisition reports). Then open Sessions by device to see whether one device carried the loss (behaviour reports).
- Next step: work on the channel that fell, in your ads or search. Redesigning the store won’t bring those visitors back.
Orders and conversion rate fell, sessions held
- What it means: people still visit, but fewer of them buy.
- Where to look: your funnel, one step at a time. The conversion rate post shows how to read it in Shopify’s reports.
- Next step: find the step where shoppers leave before you change anything.
Sessions and conversion rate moved opposite ways across 21–23 September 2026, orders flat
- What it means: if the movement started on those dates, it may well be Shopify’s counting change, not your shoppers.
- An example: in a hypothetical store, sessions rise 12% across those dates and conversion rate falls 11%. Orders come out flat.
- Where to look: orders, against the same weeks last year. Shopify’s counting change didn’t touch them.
- Next step: if orders held against last year, there may be nothing to fix. Shopify’s help page on the change says a higher or lower rate after the update isn’t automatically good or bad.
A CRO audit checks every page between the ad and the order confirmation, and ranks the fixes by likely impact.
Check what changed that week
Once you know which number moved, find when it started. In a report’s Visualization panel, turn on Show annotations. Shopify marks theme publishes, app installs and uninstalls, product publishing and system events such as metric definition changes on the chart (annotations). You can add your own notes too, for a sale or a paused campaign.
If a theme went live just before the drop, check your apps first. Apps from the old theme aren’t active in the new one until you turn them on again (apps in themes). If an app came out around the same date, the uninstall post covers the code an app can leave in your theme.
How to know you found it
The number you pick should account for most of the drop. In the example, AOV fell 15% and orders 1%, which together make the 16%. If neither explains most of the drop, both moved, and each needs its own report.
After you change something, run the same reports over the next matching weeks, with the Online Store filter wherever a report offers it. Keep orders beside sessions, as Shopify advises after its counting change.
Checklist
- Sales filtered to the Online Store channel
- Four whole weeks, Monday to Sunday, against the same weekdays 52 weeks earlier
- Orders and AOV checked before sessions and conversion rate
- AOV read from its own report, with the Online Store filter if it offers one, not total sales divided by orders
- Sessions and conversion rate compared only within one counting method
- Annotations on, to see what changed that week
A practical plan for your store, ads and email, and a partner who keeps meeting with you as the numbers move.

A collective of ecommerce veterans with 15+ years across marketing, development and UX. We audit stores, coach teams and build tools for Shopify merchants.